Liquidity Breaks and Swings
$0
Type: Indicators
Seller: Erik Istvan Fazekas
Published: 7 September 2024
Updated: 14 September 2024
Version: 1.4
Downloads: 3800


See "What's New" for a breakdown of the newest functions. v1.4 was just a tidy up, nothing special
//+---------------------------------------------------------------------------------------------------------------+
I've created this because I needed a customisable fractal indicator. It also checks for decreasing volumes to have some kind of confirmation. Breakdown below:
Overview
This indicator is designed to help identify key swing points in the market by analyzing price action and volume dynamics.
Features
The core of the indicator's strategy is based on identifying high and low patterns that often precede significant price movements. These patterns are determined by scanning the chart to look for candles with:
-
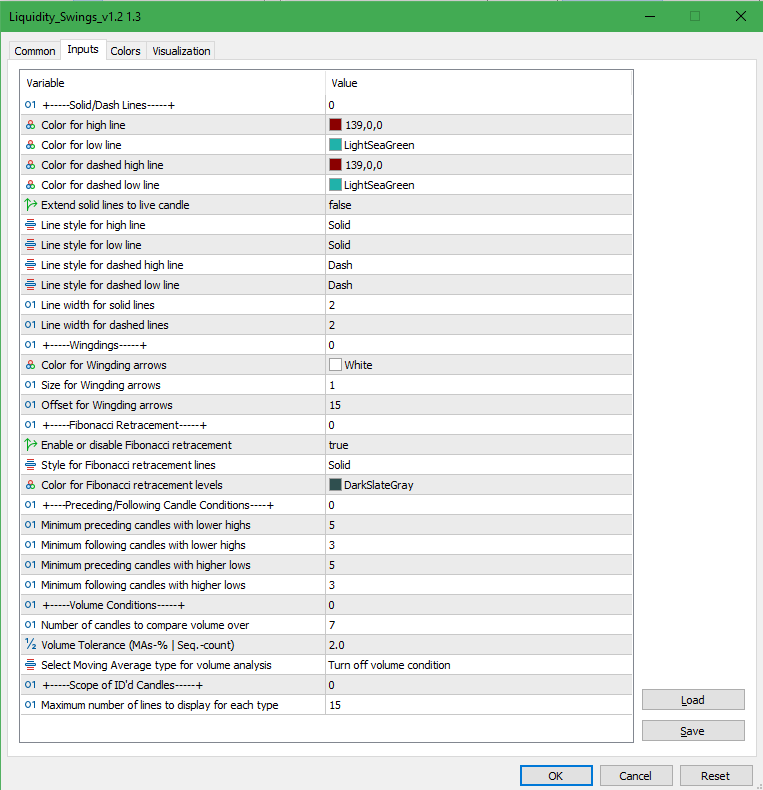
Bearish Candle Patterns: Identified when a candle's high is higher than a [User Adjustable] minimum number of preceding(Default 5) and following(Default 3) candles. Only marking it, if the candle also has a [User Adjustable] number of decreasing volume bars preceding it.
-
Bullish Candle Patterns: Identified when a candle's low is lower than a [User Adjustable] minimum number of preceding(Default 5) and following(Default 3) candles. Only marking it, if the candle also has a [User Adjustable] number of decreasing volume bars preceding it.
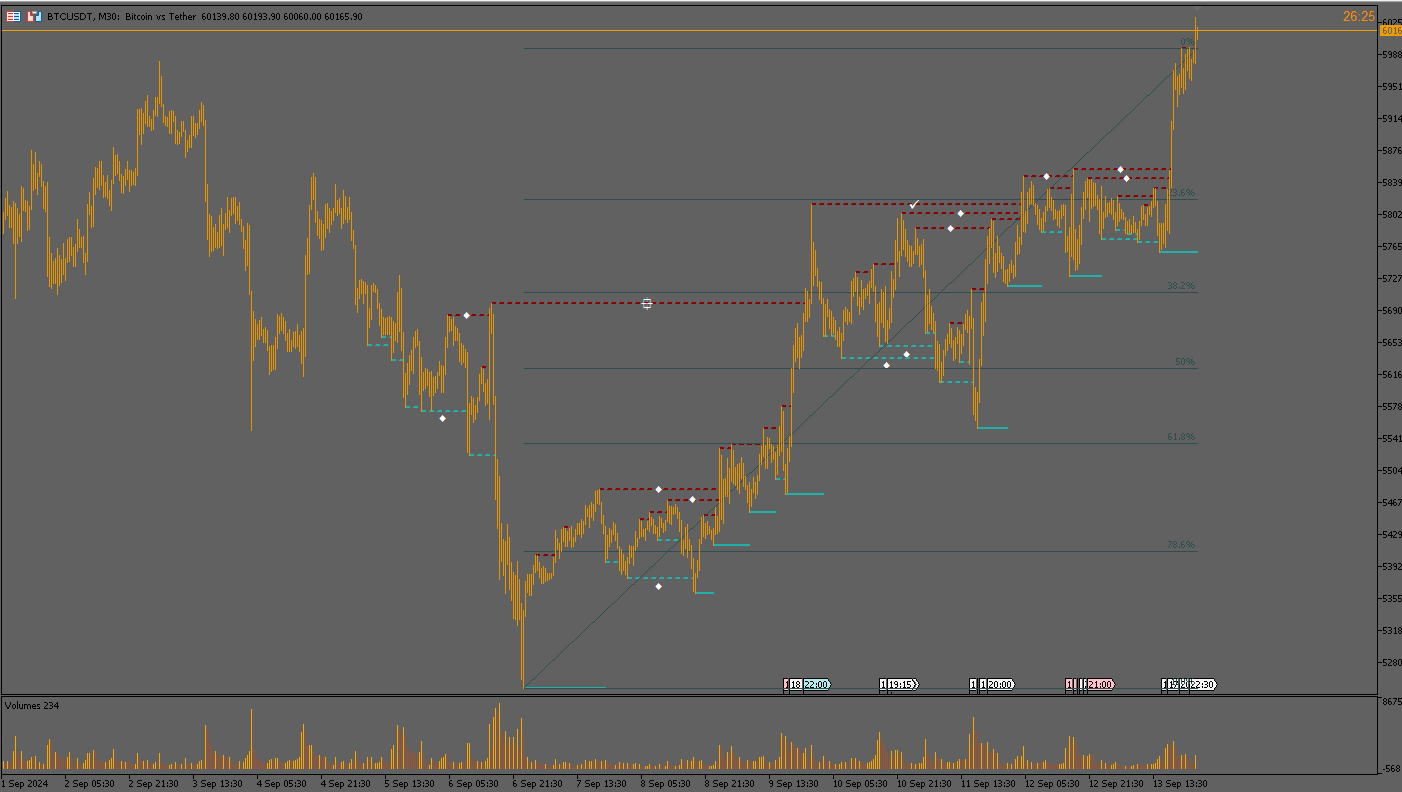
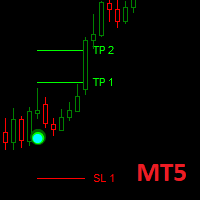
Break Line Drawing
Once a candle is identified, the indicator draws a line at the high or low of the candle. If a subsequent candle breaks above a high candle or below a low candle, the line is then converted to a dashed line, extending to the point of the break.
The number of all identified candles can be entered in the properties section, as well as an option to extend unbroken levels to the live candle.
Break Grade Classification
Each dashed line is assigned a grade based on the number of candles between the identified pattern and the break:
- "Great Swing": Extends 150 or more candles.
- "Not Bad Swing": Extends 110 to 139 candles.
- "OK Swing": Extends 70 to 109 candles.
- "Avg. Swing": Extends 30 to 69 candles.
- "Unmarked Swing": Extends less than 30 candles.
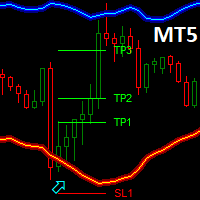
Fibonacci Retracement (optional)
The indicator also includes an automatic Fibonacci retracement feature that is dynamically drawn based on the identified swing points:
- In an uptrend, the Fibonacci retracement is drawn from the low of the lowest identified candle to the high of the highest identified candle.
- In a downtrend, the retracement is drawn from the high of the highest identified candle to the low of the lowest identified candle.
The identification of an up- or downtrend in this case is based on the highest or lowest identified candle's proximity to the live candle i.e.: If the highest identified candle is closer to our live candle, the code will evaluate it as an uptrend and vice-versa.
It's recommended to switch off the grid in order to use this one.