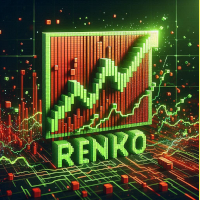
HiperCube Renko Candles
$0
Type: Indicators
Seller: Adrian Lara Carrasco
Published:
Updated:
Version:
Downloads: 600

Welcome to HiperCube Renko Candles
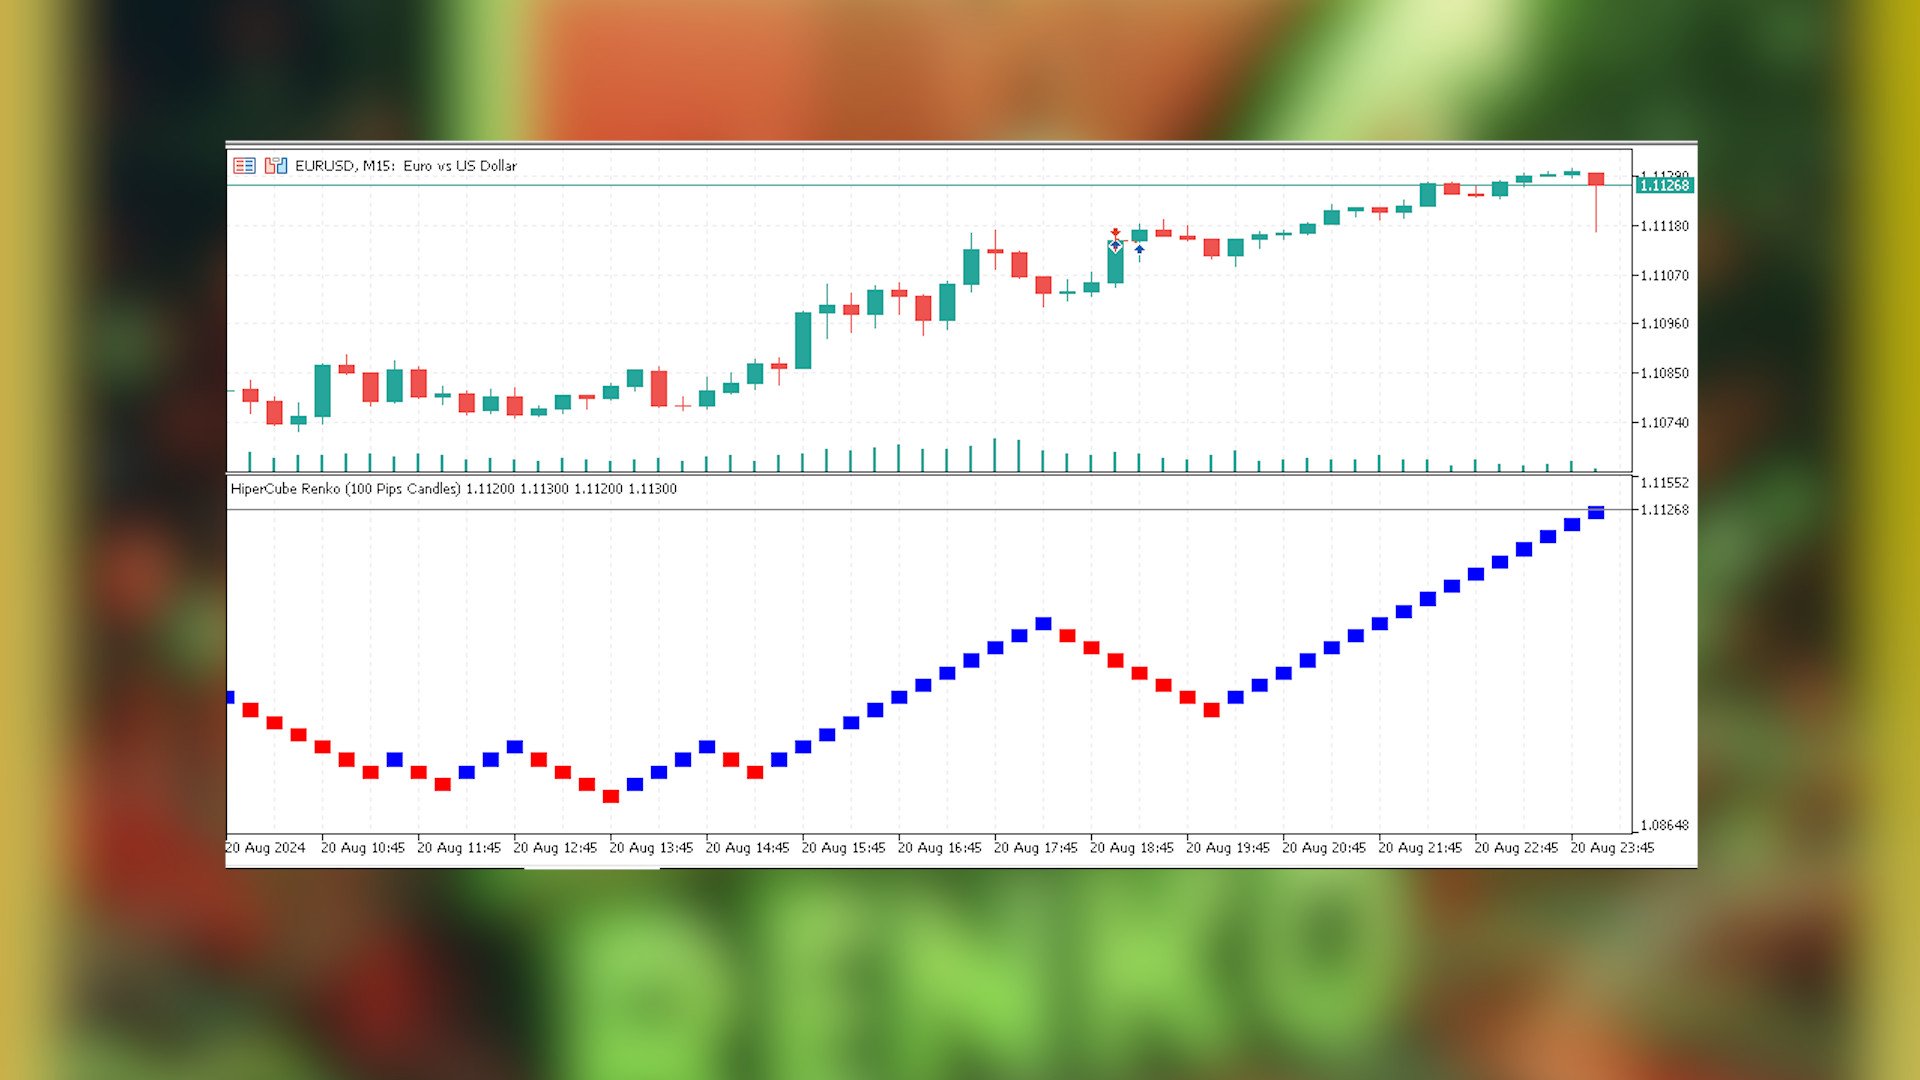
This indicator provide you a real info of market transform it to Renko Candle Style.
Definition
Renko charts are a type of financial chart that measures and plots price changes, using bricks (or bars) to represent price movements. Unlike traditional candlestick charts, Renko charts do not display time-based information, focusing solely on price fluctuations.Features:
- Indicator in separate windows
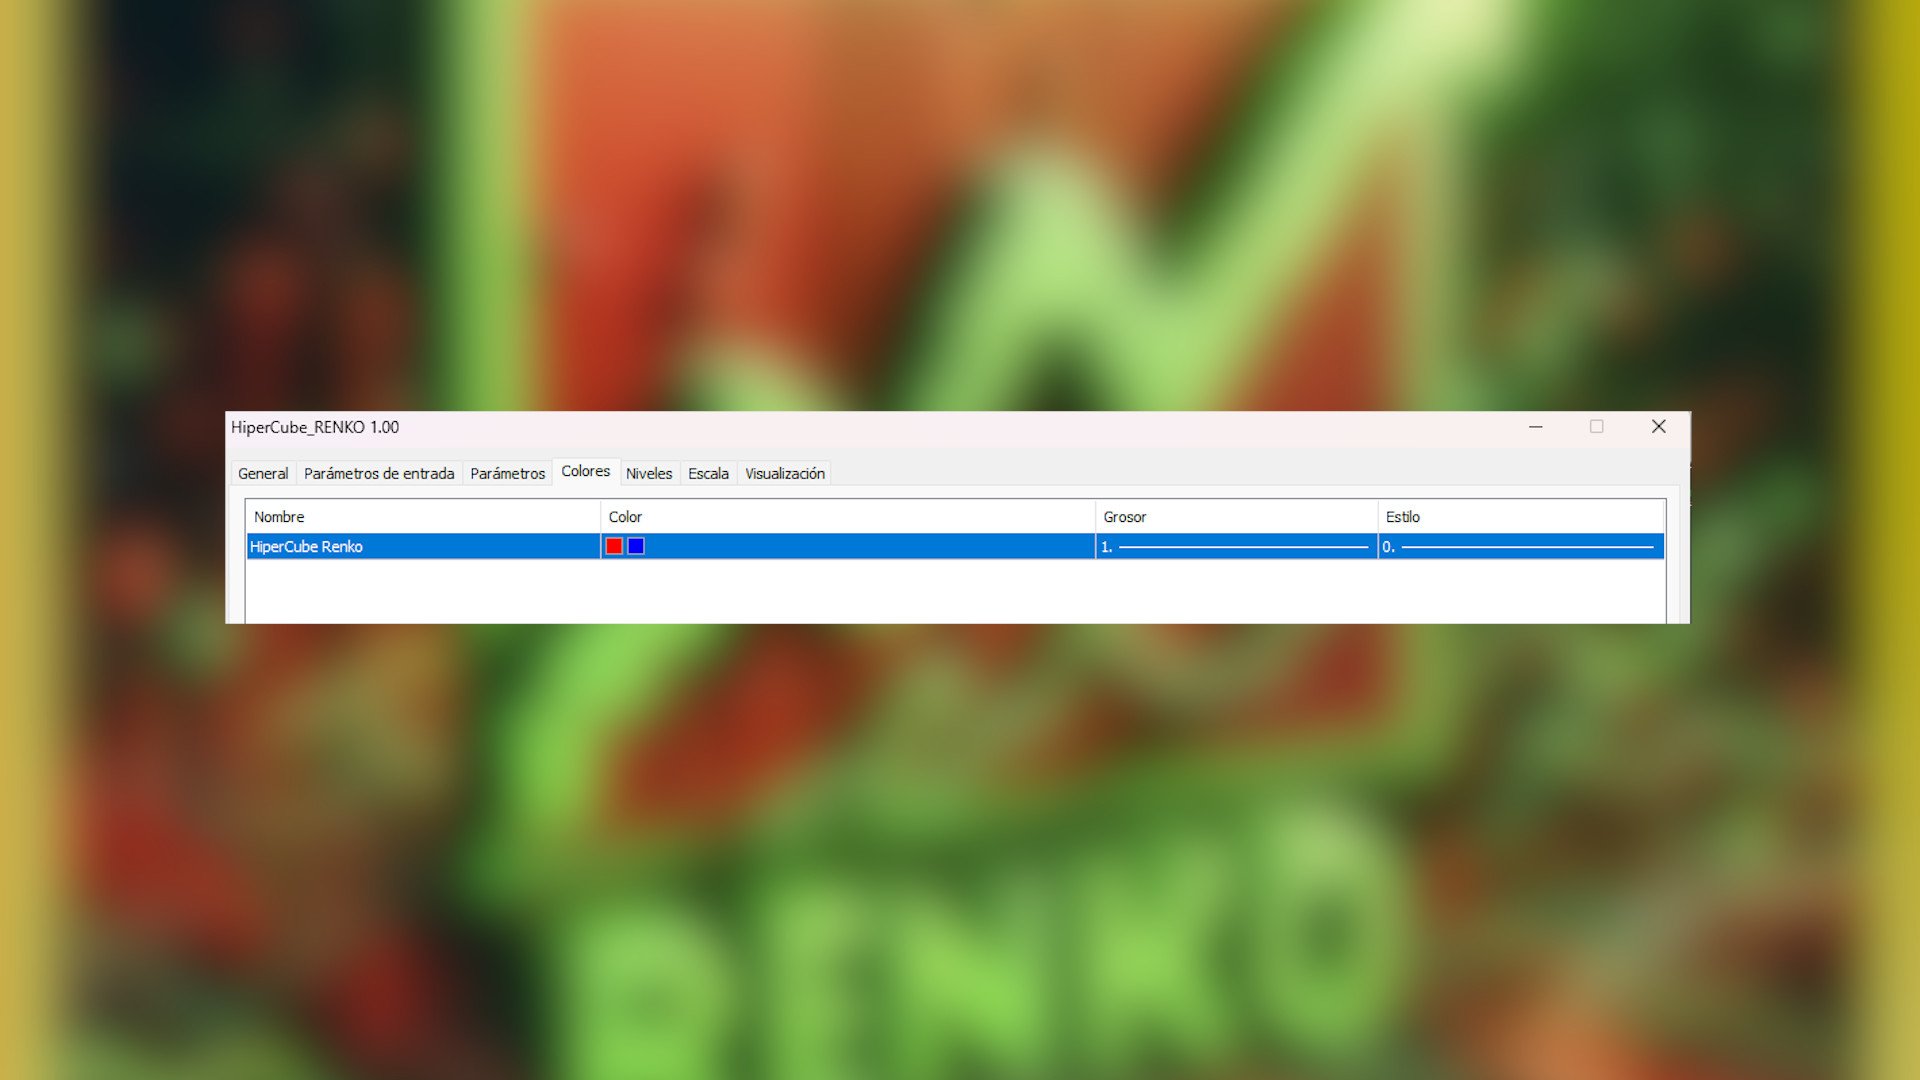
- Custom your candles Colors
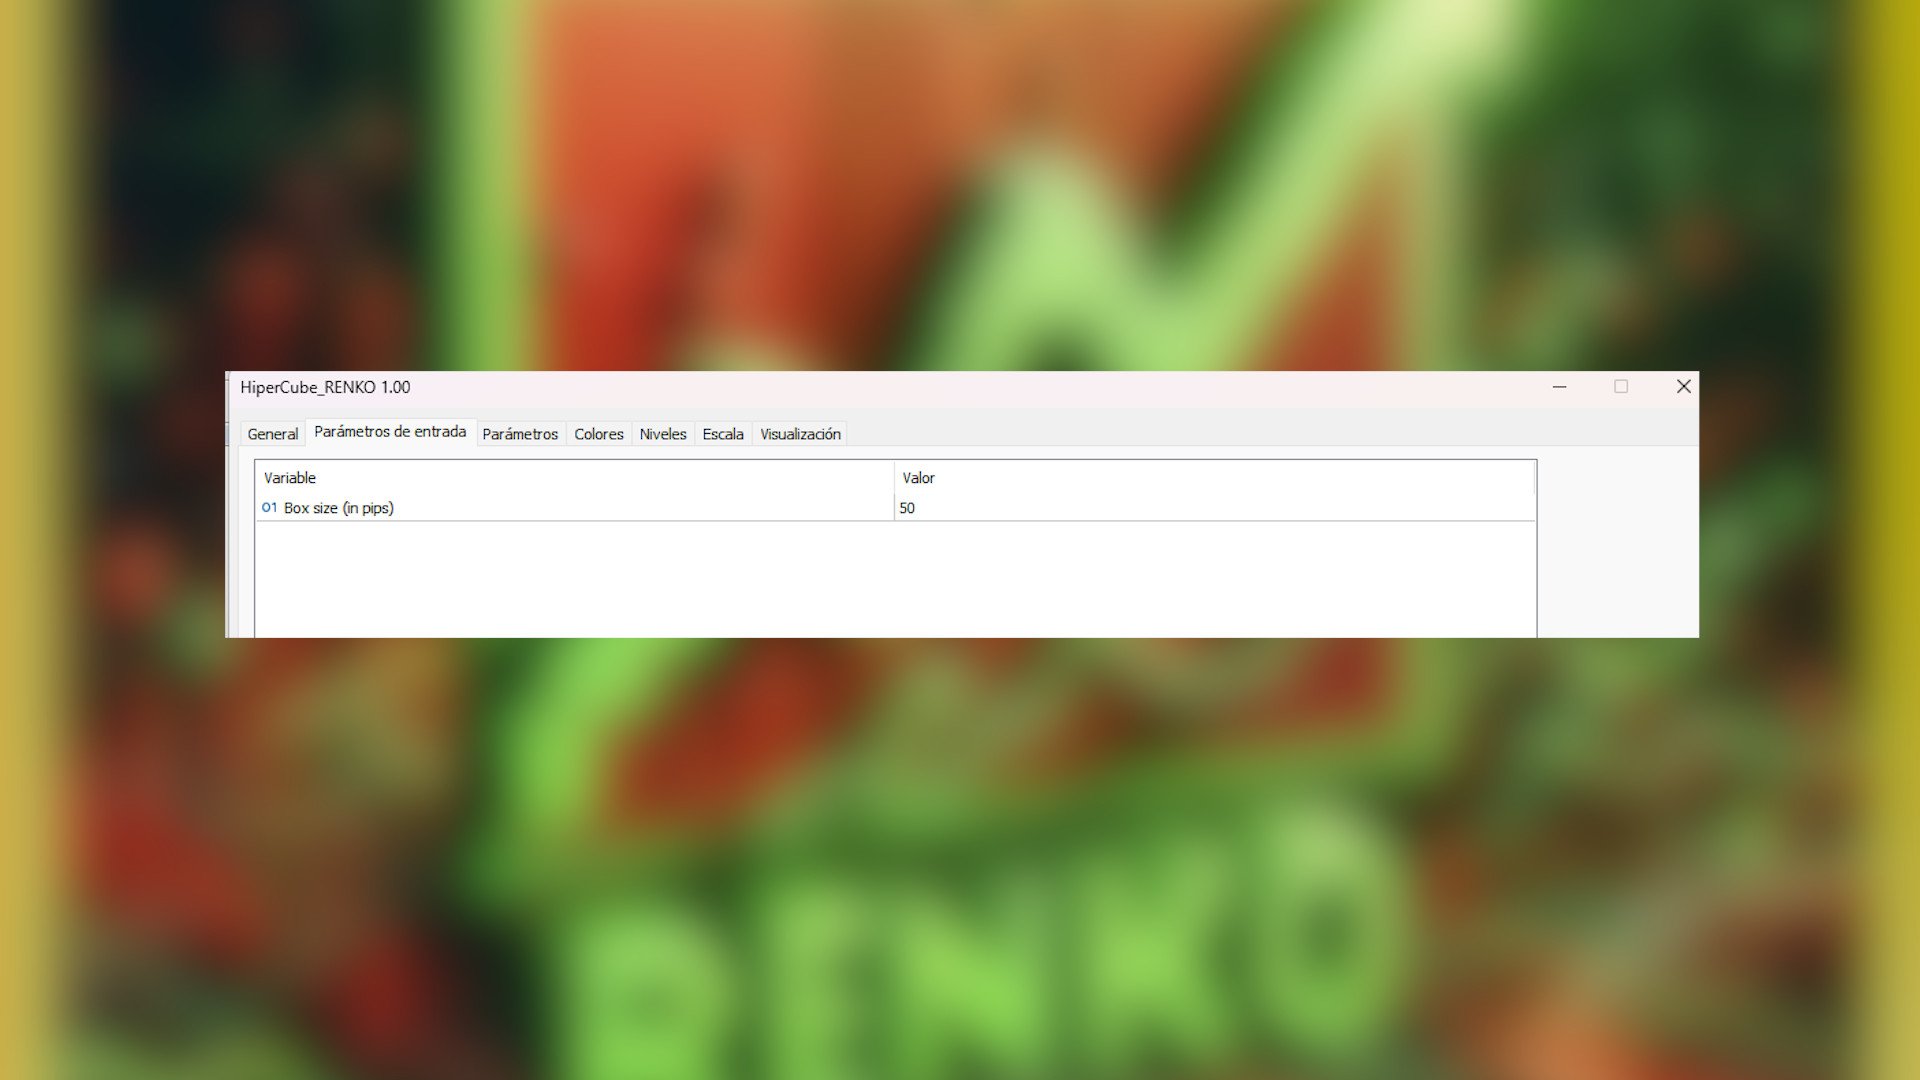
- Custom Size of Candles/Bricks in pips
- Chat GPT and AI was used to develp it
Example Strategy with Renko:
- Identify trend
- wait to pullback and engulfing with renko candles
- Put your entry
- SL Lower of engulfing
- TP at Risk Reward 1:2, 1:3...