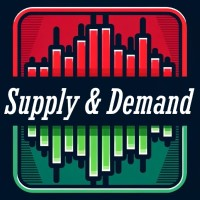
Supply and Demand Zones MT5
$0
Type: Indicators
Seller: Peter Mueller
Published: 1 October 2024
Updated:
Version: 1.0
Downloads: 6400


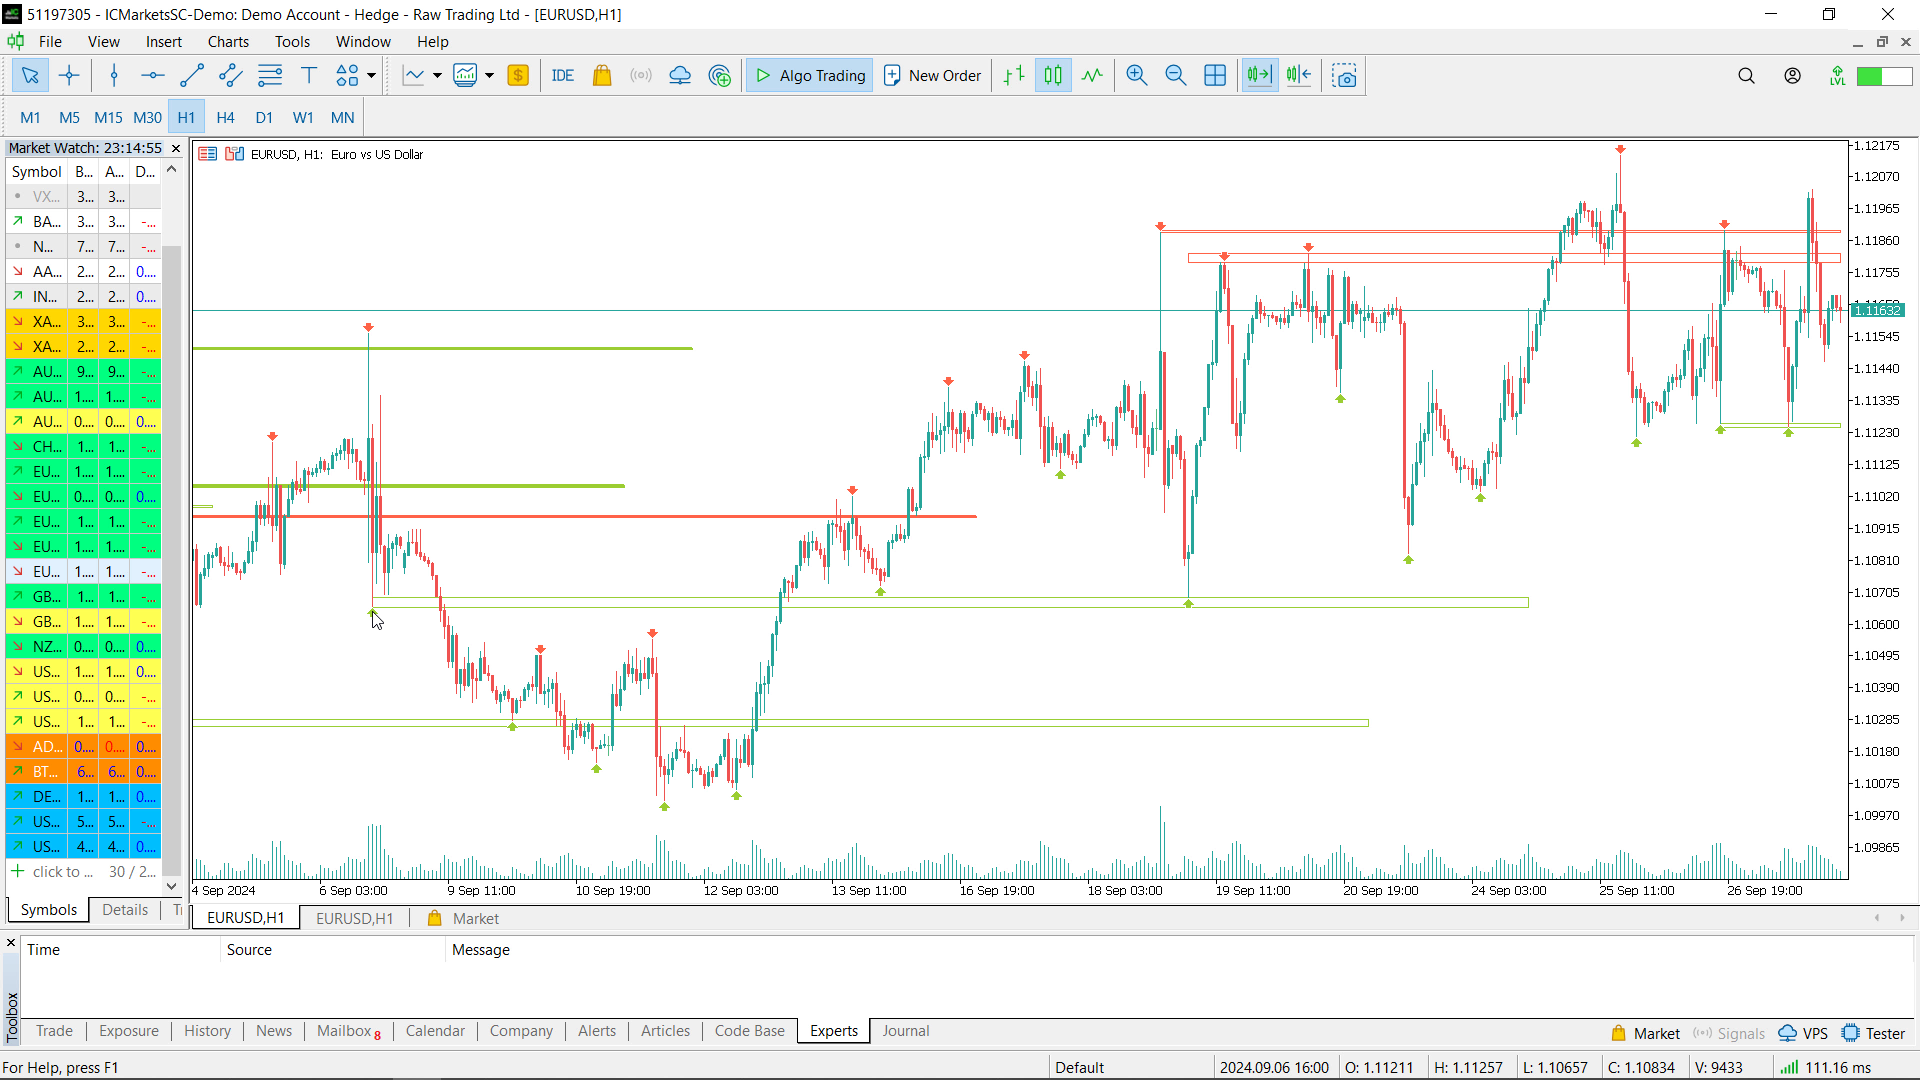
The Supply and Demand Zone Indicator is a powerful and easy-to-use tool designed to help traders identify critical supply and demand zones on the chart. These zones can provide valuable insight into potential market reversals, breakouts, and important price levels where buyers or sellers are likely to take control.
Key Features:
- Automatic Zone Detection: The indicator automatically identifies supply and demand zones based on historical price action and support/resistance levels, taking the guesswork out of manual analysis.
- Customizable Parameters: Adjust the sensitivity of the zones, number of levels to display, and the period for calculating the zones to fine-tune the indicator to your trading style.
- Visual Representation: Supply and demand zones are visually represented on the chart using customizable rectangles. You can choose whether to fill the zones or display outlines, and customize the colors for easy identification.
- Support & Resistance Levels: Optionally, display support and resistance levels with arrows to better understand how the indicator works and how zones are formed.
- Alerts: Receive notifications when the price is approaching a significant supply or demand zone by setting up customizable alerts.
- Distance Display: You can also display the distance from the nearest supply and demand level directly on the chart, giving you real-time feedback.
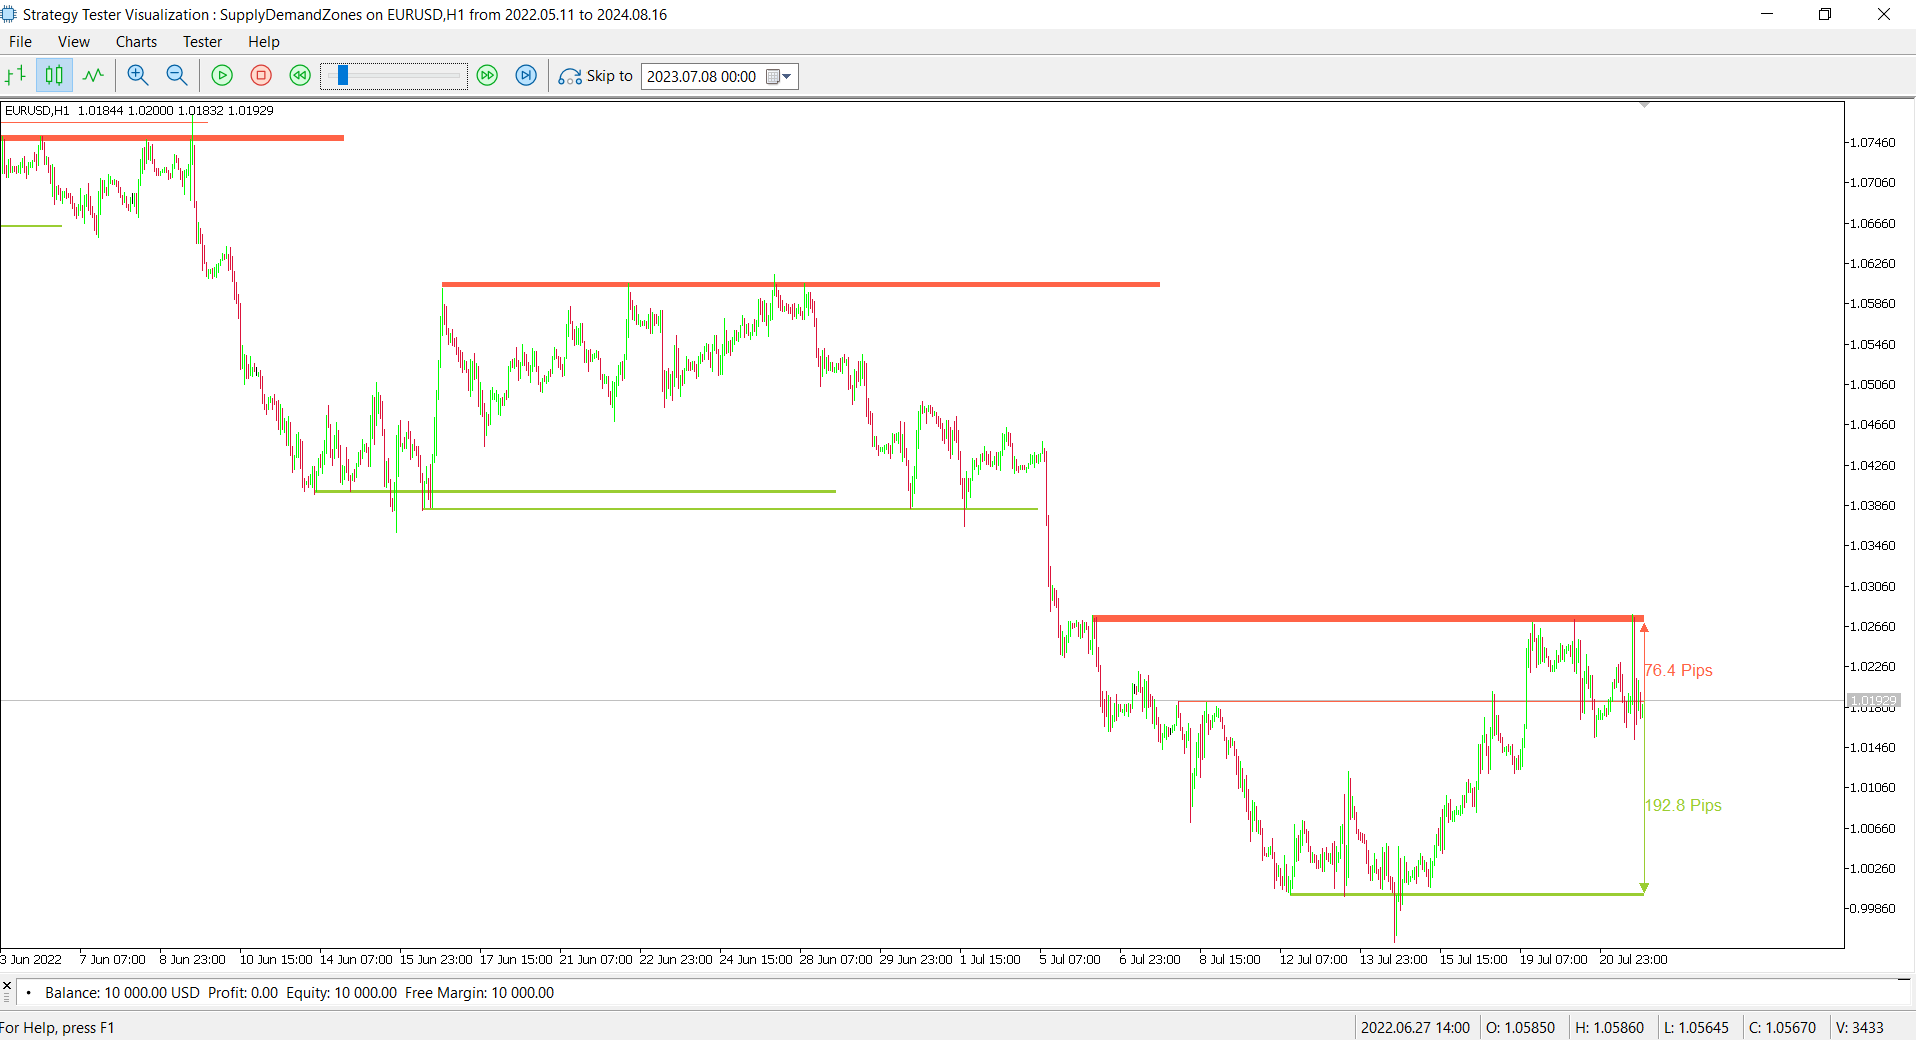
How It Works: The indicator uses support and resistance levels to form supply and demand zones. If several support levels are close to each other and price has bounced upward between them, a demand zone is formed. Similarly, if resistance levels are clustered together and the price has dropped between them, a supply zone is formed.
The indicator is highly flexible, allowing traders to customize the parameters based on their preferences and trading strategy. Whether you're looking for strict zones or wider areas of interest, the sensitivity and other settings can be adjusted to meet your needs.
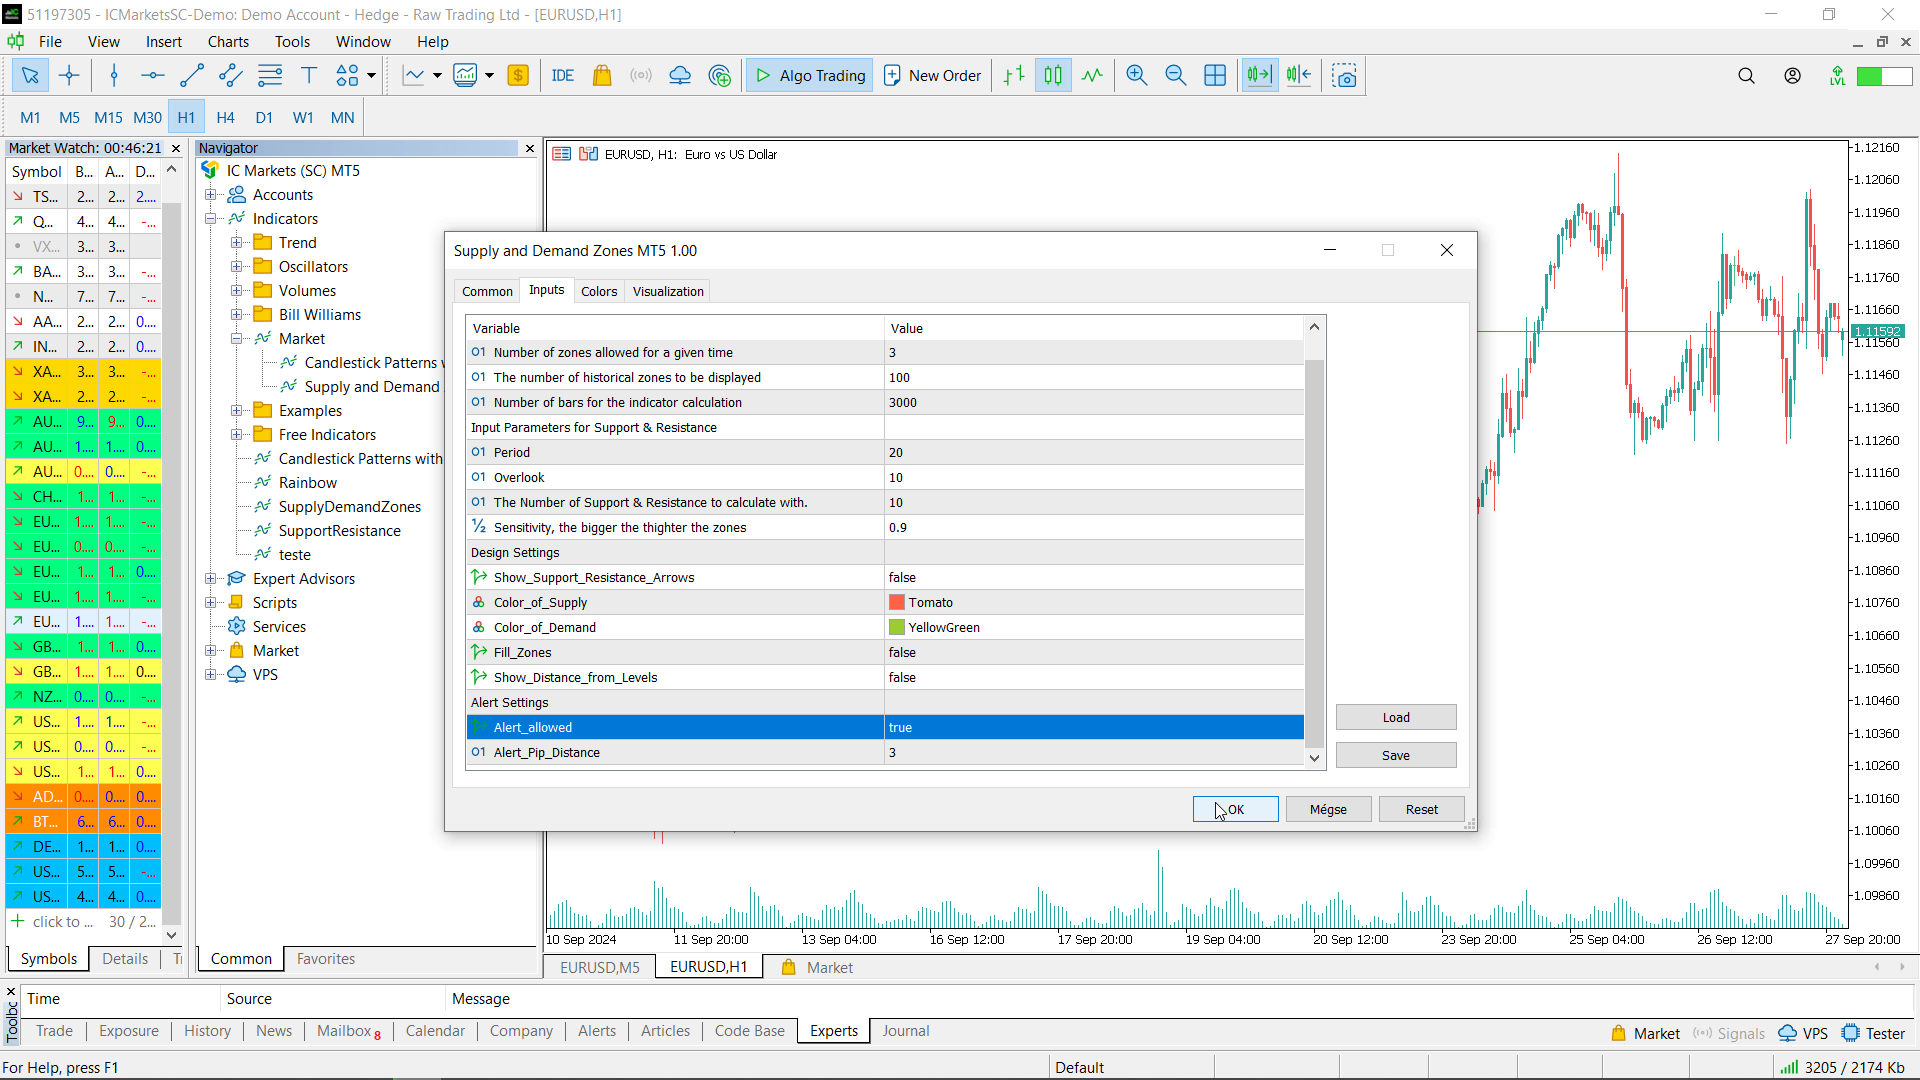
Settings & Input parameters:
-
Level_Count_Max (Default = 3):
Defines the maximum number of zones that can be displayed on the chart at any given time. -
Historical_Level_Count (Default = 100):
Sets the number of historical supply and demand zones that will be displayed on the chart. -
Look_Back_Bars (Default = 3000):
Specifies how many bars back the indicator will consider for its calculations. A higher number of bars means more data is used for calculating the zones, which could take longer to process.
-
Period (Default = 20):
Defines the number of bars the indicator uses to calculate the support and resistance levels. For example, it looks at the maximum/minimum price in the last 20 bars to identify potential levels. -
Overlook (Default = 10):
Sets the number of additional bars considered when identifying support and resistance levels. This can help refine the detection of levels beyond the immediate price action. -
Number_of_Levels_to_Calculate_With (Default = 10):
Specifies how many of the most recent support and resistance levels should be used when calculating potential supply and demand zones. -
Sensitivity (Default = 0.90):
Controls how closely two support or resistance levels need to be to form a zone. The higher the value, the more tightly the zones must cluster together to be considered valid. Lower values allow for wider zones.
-
Show_Support_Resistance_Arrows (Default = false):
If enabled, arrows will be drawn on the chart to show the exact points where support and resistance levels were calculated, helping you understand the mechanics behind the indicator. -
Color_of_Supply (Default = clrTomato):
Sets the color used to represent the supply zones on the chart. The default color is Tomato. -
Color_of_Demand (Default = clrYellowGreen):
Sets the color used to represent the demand zones on the chart. The default color is YellowGreen. -
Fill_Zones (Default = false):
If enabled, the indicator will fill the supply and demand zones with the specified colors. If disabled, it will only draw the outlines of the zones. -
Show_Distance_from_Levels (Default = false):
If enabled, the indicator will display the distance in pips from the current price to the nearest supply or demand level, giving you a real-time sense of proximity to key zones.
-
Alert_Allowed (Default = false):
If enabled, the indicator will trigger an alert when the price approaches a significant supply or demand zone, as defined by the Alert_Pip_Distance parameter. -
Alert_Pip_Distance (Default = 1):
Sets the distance in pips from the current price to a supply or demand zone at which the alert will trigger. For example, if set to 1 pip, the alert will sound when the price is within 1 pip of a zone.
Repainting Indicator: Please note that the indicator repaints as new data comes in, meaning the zones adjust dynamically based on how price moves and forms new highs or lows.
Use Case: This indicator is suitable for all types of traders, including swing traders, day traders, and long-term investors who rely on price action. It helps identify critical zones where the market could react, allowing you to make more informed trading decisions.
The best .
If you want to create your own Hedging or Grid strategies without any coding make sure to check out the
#tags: Supply Demand & Supply & demand, free supply demand free supply and demand best supply and demand best free supply demand