Peak Trough Analysis Tool MT5

$0
Type: Indicators
Seller: Young Ho Seo
Published:
Updated:
Version:
Downloads: 700


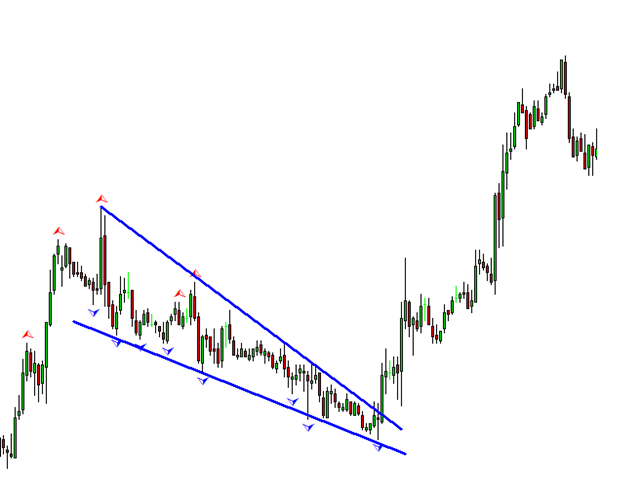
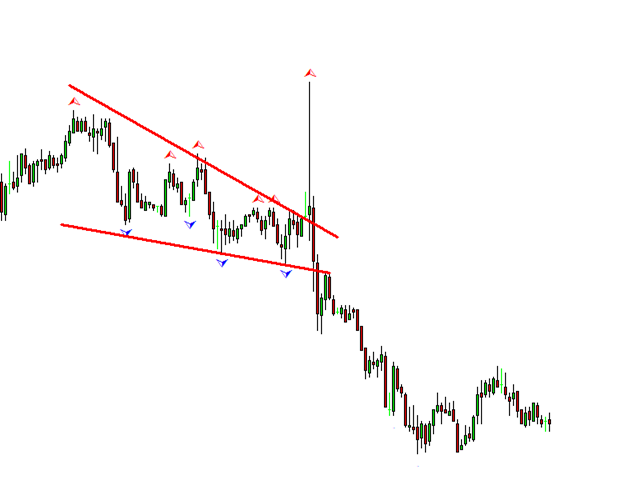
Peak Trough Analysis is the great tool to detect peaks and troughs in your chart. Peak Trough Analysis tool can use three different peaks and troughs detection algorithm. The three algorithm include the orignal Fractals Indicator by Bill Williams, the Modified Fractals indicator and ZigZag indicator. You can use this peak and trough analysis tool to detect the price pattern made up from Equilibrium Fractal-Wave process. For further usage, there are good guide line on how to use this peak trough analysis tool in the chapter 11 in the book: Introduction to Price Action and Pattern Trading. This is a free tool and you can use this powerful tool for your own benefit at your own risk.
How to use
You can use in three mode.
- Mode 1: The Fractals indicator by Bill Williams
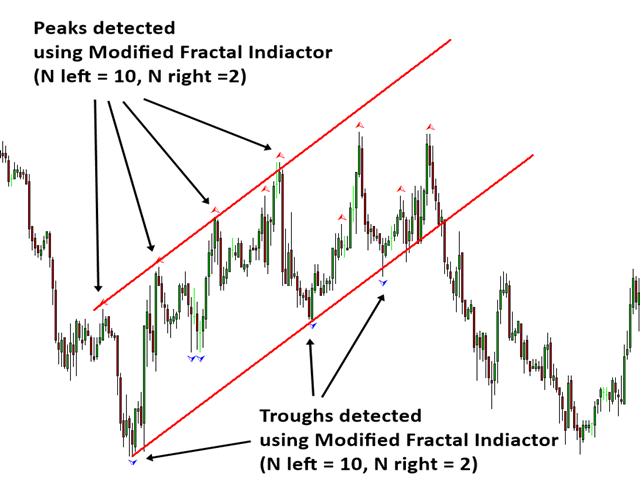
- Mode 2: The Modified Fractals indicator
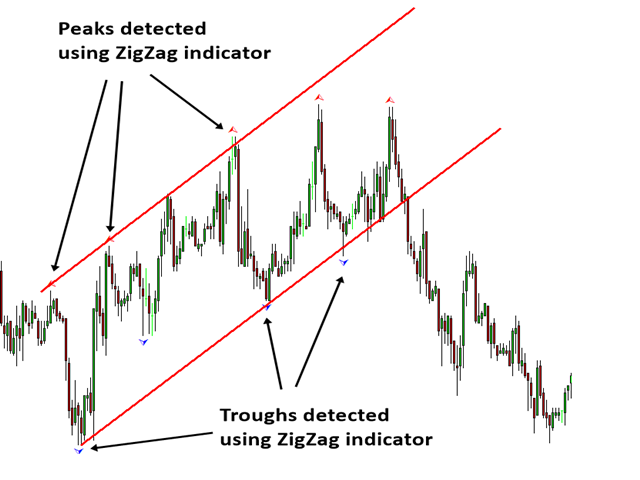
- Mode 3: Zig Zag indicator
To use Modified Fractals Indicator algorithm, set “Use Modified Fractals” = true.
To use for Zig Zag indicator algorithm, set “Modified Fractals” = false.
To use the original Fractals Indicator algorithm by Bill Williams, set “Use Modified Fractals” = true. Set N left = N right = 2.
Input Setting
1. Modified Fractals Setting
- N left - N = number of bars counting to left
- N right - N = number of bars counting to right
2. Zig Zag Setting
Use default setting unless you are familiar with ZigZag indicator.
- ZigZag Depth
- ZigZag Deviation
- ZigZag Backstep
3. General Setting
- Arrow Shift in Pixels - 10 = default
- Use White Background Chart - true or false only
- Enable sound alert - true or false only
- Send email if peak or trough is found - true or false only
- Send notification if peak or trough is found - true or false only
Trading Strategy Guide
Using Peak Trough Analysis is documented in the link below. It is highly recommended to read this article before trading.
In addition, you can find the trading strategy guide from the links below:
Guide for Volume Spread Analysis:
Guide for Harmonic Pattern Detection Indicator:
Guide for Momentum Indicator:
Guide for Supply Demand Indicator:
Guide for Elliott Wave Indicator:
Guide for Volatility Indicator:
Important Note
This is the off the shelf product. Therefore, we do not accept any modification or customization request on this product. In addition, we do not provide any code library or any support for your coding for this product.