FractalZones
$0
Type: Indicators
Seller: GEORGI ANIKIN
Published: 28 March 2021
Updated: 8 October 2024
Version: 1.4
Downloads: 1500


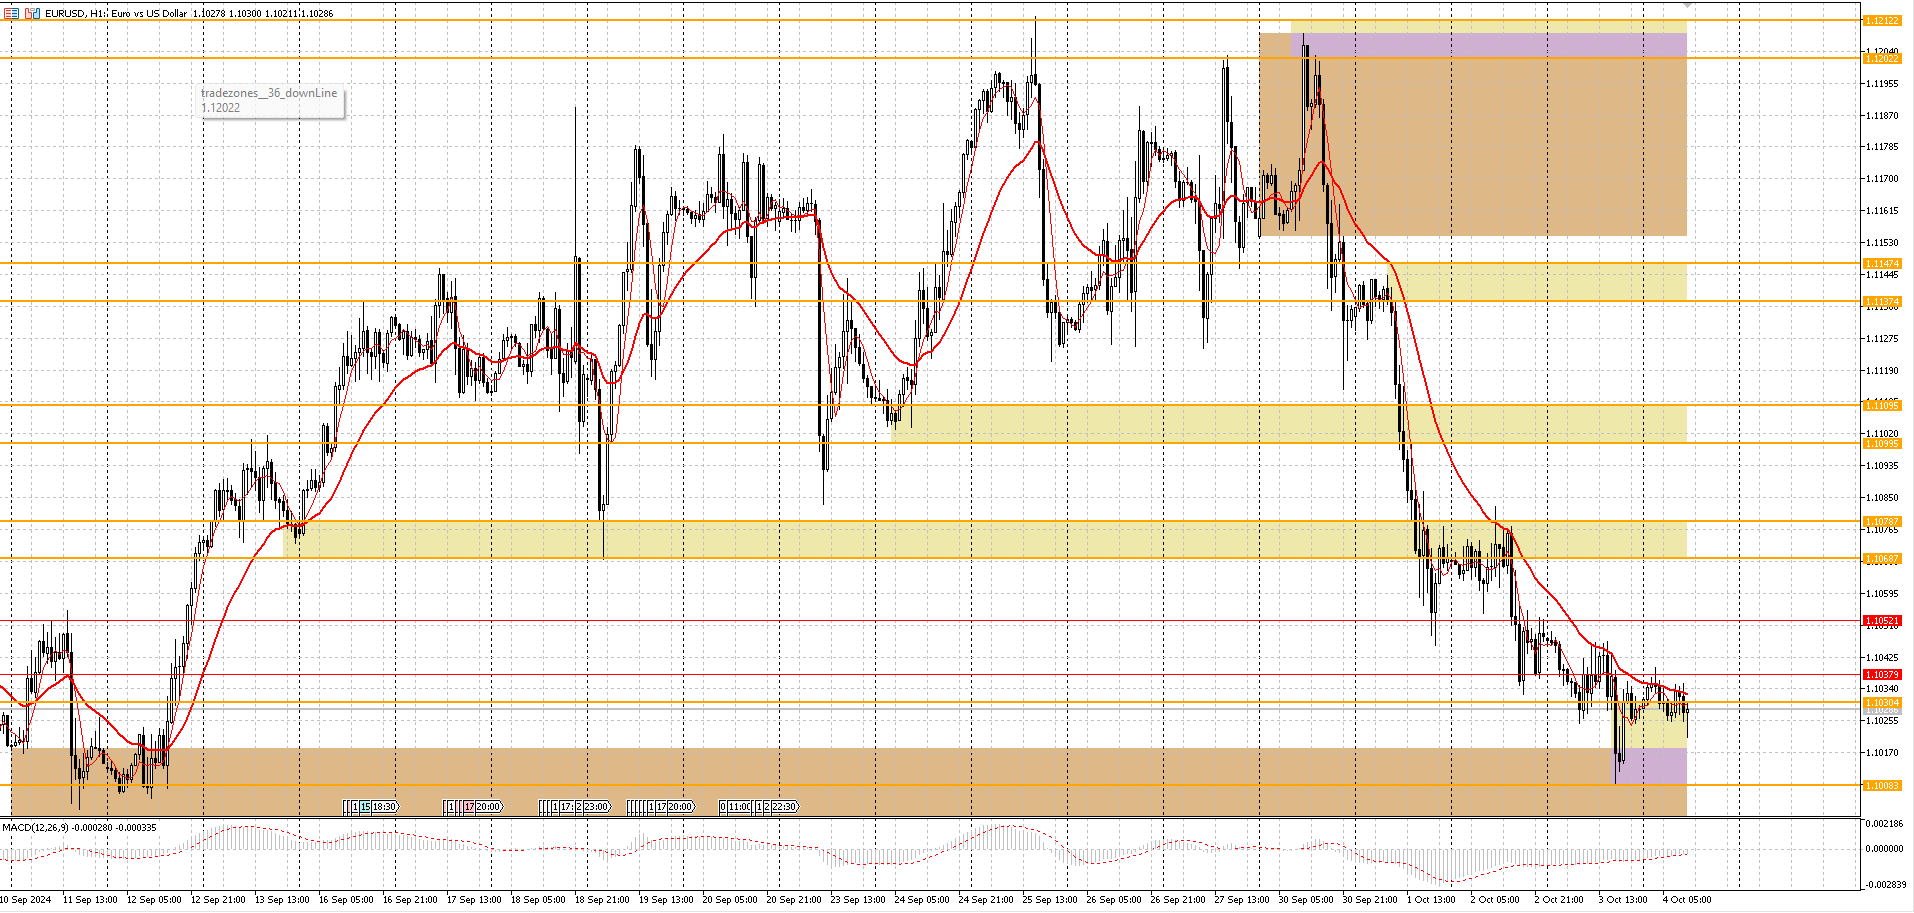
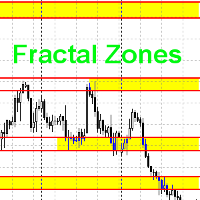
This indicator draws trading zones based on fractals from higher periods, which simplifies trading by levels.
This indicator draws two types of trading zones on one chart.
For example, if the current period is H1, then trading zones will be searched for by fractals from H4 and D1.
In the standard settings, fractal zones from H4 will be drawn in yellow, and from D1 - in green.
When zones are superimposed, colors are mixed at the intersection of zones. I don’t know how to fix this at the moment.
The principle of searching for fractal zones
The zones are found by fractals. During the enumeration of fractals, fractal zones are found. When checking the next fractal, it is checked whether this zone already exists or not. If this zone does not exist, a new zone is created. The height of the zone is determined by the height of the shadow of the fractal candle. If the height of the zone is too small, it increases to the minimum height.
Principle of displaying fractal zones
For each period, there is a search for fractal zones from older periods:
| Period | Search for younger zones | Search for older zones |
|---|---|---|
| H1 | H4 | D1 |
| H4 | D1 | W1 |
| D1 | W1 | MN1 |
| W1 | MN1 | - |
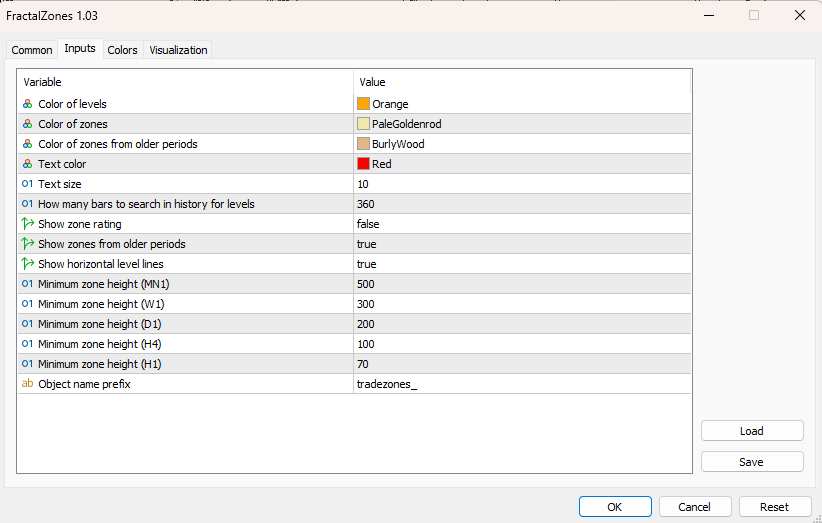
Description of parameters
In the settings, you can change the following parameters:
- Level color
- Zone color from the next period
- Zone color from the older period
- Text color
- Text size
- For how many bars to search for fractal zones
- Show zone rating
- Show zones of older periods
- Minimum height for each zone
- Object name prefix
I don't know how much rating is needed. This is still an experiment. By zone rating, I mean how many fractals touched the fractal zone. If there is no need for this, I will remove the rating.