Gold H1 Scalper
$0
Type: Experts
Seller: Yashar Seyyedin
Published:
Updated:
Version:
Downloads: 0


Strategy description
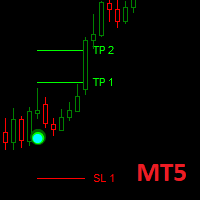
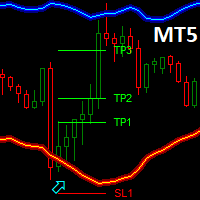
- The idea is to go with trend resumption.
Instruments
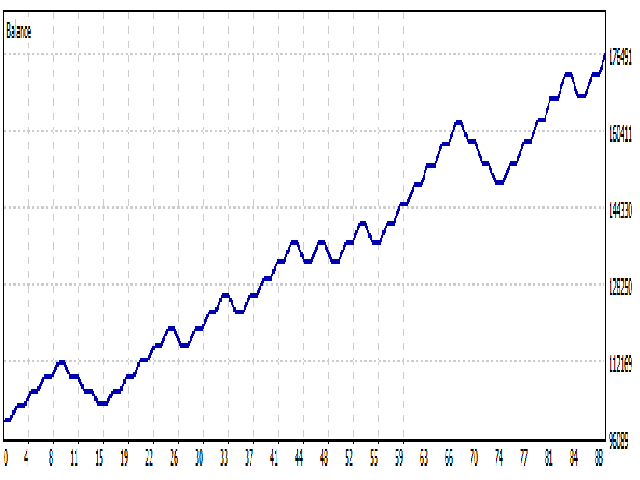
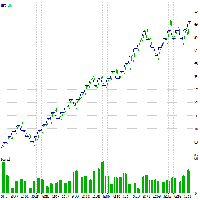
Backtest on XAUUSD shows profitability over a long period even without any specific optimization efforts. However applying optimization makes it even better.Backtest details:
Simulation Type=Every tick(Most accurate)
| Expert: | GoldScalper | |||||||||||
| Symbol: | XAUUSD | |||||||||||
| Period: | H1 (2020.01.01 - 2023.02.28) | |||||||||||
| Inputs: | magic_number=1234 | |||||||||||
| ob=90.0 | ||||||||||||
| os=24.0 | ||||||||||||
| risk_percent=2.64 | ||||||||||||
| time_frame=16385 | ||||||||||||
| Company: | FIBO Group, Ltd. | |||||||||||
| Currency: | USD | |||||||||||
| Initial Deposit: | 100 000.00 | |||||||||||
| Leverage: | 1:100 | |||||||||||
Results | ||||||||||||
| History Quality: | 51% | |||||||||||
| Bars: | 18345 | Ticks: | 2330147 | Symbols: | 1 | |||||||
| Total Net Profit: | 77 299.48 | Balance Drawdown Absolute: | 43.78 | Equity Drawdown Absolute: | 392.80 | |||||||
| Gross Profit: | 122 072.98 | Balance Drawdown Maximal: | 12 723.94 (7.84%) | Equity Drawdown Maximal: | 16 770.85 (10.20%) | |||||||
| Gross Loss: | -44 773.50 | Balance Drawdown Relative: | 7.84% (12 723.94) | Equity Drawdown Relative: | 11.41% (13 019.99) | |||||||
| Profit Factor: | 2.73 | Expected Payoff: | 1 756.81 | Margin Level: | 1137.60% | |||||||
| Recovery Factor: | 4.61 | Sharpe Ratio: | 8.98 | Z-Score: | -0.37 (28.86%) | |||||||
| AHPR: | 1.0134 (1.34%) | LR Correlation: | 0.98 | OnTester result: | 0 | |||||||
| GHPR: | 1.0131 (1.31%) | LR Standard Error: | 4 101.83 | |||||||||
| Total Trades: | 44 | Short Trades (won %): | 14 (71.43%) | Long Trades (won %): | 30 (73.33%) | |||||||
| Total Deals: | 88 | Profit Trades (% of total): | 32 (72.73%) | Loss Trades (% of total): | 12 (27.27%) | |||||||
| Largest profit trade: | 4 945.33 | Largest loss trade: | -4 603.20 | |||||||||
| Average profit trade: | 3 814.78 | Average loss trade: | -3 731.13 | |||||||||
| Maximum consecutive wins ($): | 6 (25 334.15) | Maximum consecutive losses ($): | 3 (-12 603.60) | |||||||||
| Maximal consecutive profit (count): | 25 334.15 (6) | Maximal consecutive loss (count): | -12 603.60 (3) | |||||||||
| Average consecutive wins: | 4 | Average consecutive losses: | 2 | |||||||||
Processing load
- This is a light processing EA which works based on candle closure.
inputs and optimization
Available inputs are:
- magic number: makes it possible to execute the expert advisor on several charts.
- ob: used for optimization purposes
- os: used for optimization putposes
- risk per trade%: how much to risk in percentage for each trade(based on current equity)
- time_frame: applied time_frame
- RR: reward/risk ratio
warning: Please backtest with the exact instrument before applying to real money.
note: For MT4 version please contact via private message